Colormap
Example usage
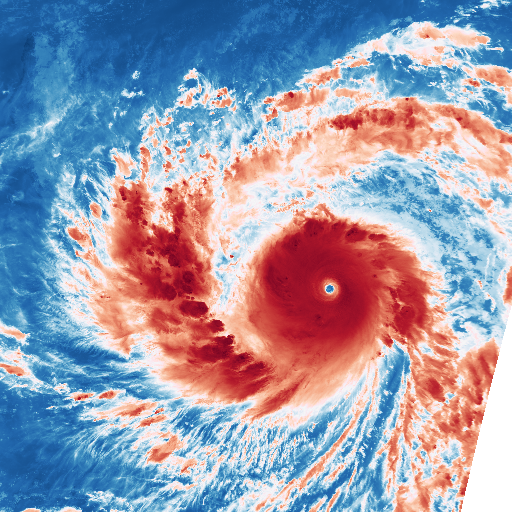
A simple example of applying a colormap on data:
from trollimage.colormap import rdbu
from trollimage.image import Image
img = Image(data, mode="L")
rdbu.set_range(-90 + 273.15, 30 + 273.15)
img.colorize(rdbu)
img.show()

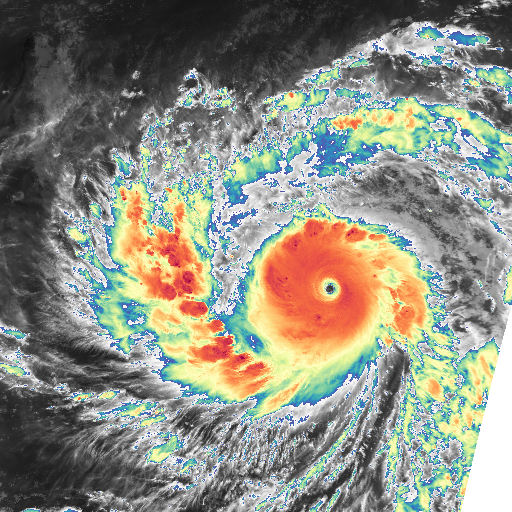
A more complex example, with a colormap build from greyscale on one end, and spectral on the other, like this:

from trollimage.colormap import spectral, greys
from trollimage.image import Image
img = Image(data, mode="L")
greys.set_range(-40 + 273.15, 30 + 273.15)
spectral.set_range(-90 + 273.15, -40.00001 + 273.15)
my_cm = spectral + greys
img.colorize(my_cm)
img.show()

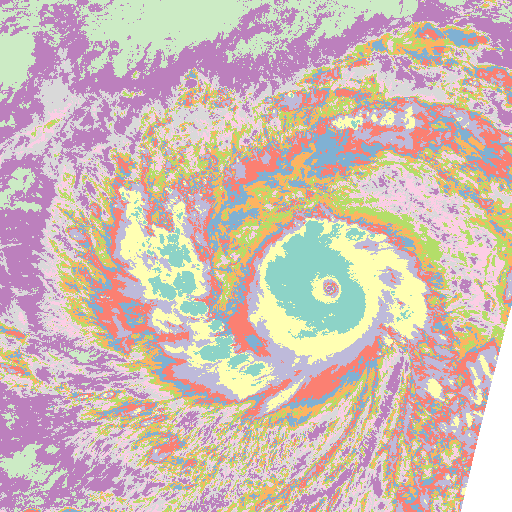
Now applying a palette to the data, with sharp edges:
from trollimage.colormap import set3
from trollimage.image import Image
img = Image(data, mode="L")
set3.set_range(-90 + 273.15, 30 + 273.15)
img.palettize(set3)
img.show()

API
A simple colormap module.
- class trollimage.colormap.Colormap(*tuples, **kwargs)
The colormap object.
- Parameters
*args – Series of (value, color) tuples. These positional arguments are only used if the
values
andcolors
keyword arguments aren’t provided.values – One dimensional array-like of control points where each corresponding color is applied. Must be the same number of elements as colors and must be monotonic.
colors – Two dimensional array-like of RGB or RGBA colors where each color is applied to a specific control point. Must be the same number of colors as control points (values). Colors should be floating point numbers between 0 and 1.
Initialize with tuples of (value, (colors)), like this:
Colormap((-75.0, (1.0, 1.0, 0.0)), (-40.0001, (0.0, 1.0, 1.0)), (-40.0, (1, 1, 1)), (30.0, (0, 0, 0)))
You can also concatenate colormaps together, try:
cm = cm1 + cm2
- colorize(data)
Colorize a monochromatic array data, based on the current colormap.
- classmethod from_array_with_metadata(palette, dtype, color_scale=255, valid_range=None, scale_factor=1, add_offset=0, remove_last=True)
Create Colormap from an array with metadata.
Create a colormap from an array with associated metadata, either in attributes or passed on to the function.
For historical reasons, this method exists alongside
from_ndarray()
andfrom_sequence_of_colors()
despite similar functionality.If
palette
is an xarray dataarray with the attributepalette_meanings
, those meanings are interpreted as values associated with the colormap.If no values can be interpreted from the metadata, values will be linearly interpolated between 0 and 255 (if
dtype
isnp.uint8
) or according tovalid_range
.- Parameters
palette (ndarray or xarray.DataArray) – Array describing colors, possibly with metadata. If it has a
palette_meanings
attribute, this will be used for color interpretation.dtype – dtype for the colormap
color_scale (number) – The value that represents white in the numbers describing the colors. Defaults to 255, could also be 1 or something else.
valid_range – valid range for colors, if colormap is not of dtype uint8
scale_factor – scale factor to apply to the colormap
add_offset – add offset to apply to the colormap
remove_last – Remove the last value if the array has no metadata associated. Defaults to true for historical reasons.
- classmethod from_csv(path, colormap_mode=None, color_scale=255)
Create Colormap from CSV file.
Create a Colormap from a file that contains comma seperated values (CSV).
To read from a string that contains CSV, use
from_string()
.- Parameters
string (str or pathlib.Path) – Path to file containing CSV. The CSV must have at least three and at most five columns and describe entirely numeric data.
colormap_mode (str or None) – Optional. Can be None, “RGB”, “RGBA”, “VRGB”, or “VRGBA”. If None (default), this is inferred from the dimensions of the data contained in the CSV. Modes starting with V have in the first column the values to which the color relates.
color_scale (number) – The value that represents white in the numbers describing the colors. Defaults to 255, could also be 1 or something else.
- classmethod from_file(filename: str, colormap_mode: Optional[str] = None, color_scale: Number = 255)
Create Colormap from a comma-separated or binary file of colormap data.
- Parameters
filename – Filename of a binary or CSV file
colormap_mode – Force the scheme of the colormap data (ex. RGBA). See information below on other possible values and how they are interpreted. By default this is determined based on the number of columns in the data.
color_scale – The maximum possible color value in the colormap data provided. For example, if the colors in the provided data were 8-bit unsigned integers this should be 255 (the default). This value will be used to normalize the colors from 0 to 1.
Colormaps can be loaded from
.npy
,.npz
, or comma-separated text files. Numpy (npy/npz) files should be 2D arrays with rows for each color. Comma-separated files should have a row for each color with each column representing a single value/channel. A filename ending with.npy
or.npz
is read as a numpy file withnumpy.load()
. All other extensions are read as a comma-separated file. For.npz
files the data must be stored as a positional list where the first element represents the colormap to use. Seenumpy.savez()
for more information.The colormap is interpreted as 1 of 4 different “colormap modes”:
RGB
,RGBA
,VRGB
, orVRGBA
. The colormap mode can be forced with thecolormap_mode
keyword argument. If it is not provided then a default will be chosen based on the number of columns in the array (3: RGB, 4: VRGB, 5: VRGBA).The “V” in the possible colormap modes represents the control value of where that color should be applied. If “V” is not provided in the colormap data it defaults to the row index in the colormap array (0, 1, 2, …) divided by the total number of colors to produce a number between 0 and 1. See the “Set Range” section below for more information. The remaining elements in the colormap array represent the Red (R), Green (G), and Blue (B) color to be mapped to.
See the “Color Scale” section below for more information on the value range of provided numbers.
To read from a string containing CSV, use
from_csv()
.To get a named colormap, use
from_name()
or load the colormap directly as a module attribute.To get a colormap from an ndarray, use
from_ndarray()
.Color Scale
By default colors are expected to be in a 0-255 range. This can be overridden by specifying
color_scale
keyword argument. A common alternative to 255 is1
to specify floating point numbers between 0 and 1. The resulting Colormap uses the normalized color values (0-1).
- classmethod from_name(name)
Return named colormap.
Return a colormap by name. Supported colormaps are the ones defined in the module namespace.
- Parameters
name (str) – Name of colormap.
- classmethod from_ndarray(cmap_data, colormap_mode=None, color_scale=255)
Create Colormap from ndarray.
Create a colormap from a numpy data array.
The data should contain at least three and at most five columns.
For historical reasons, this method exists alongside
from_sequence_of_colors()
andfrom_array_with_metadata()
despite similar functionality.- Parameters
cmap_data (ndarray) – Array describing the colours. Must have at least three and at most five columns and have a numeric dtype.
colormap_mode (str or None) – Optional. Can be None, “RGB”, “RGBA”, “VRGB”, or “VRGBA”. If None (default), this is inferred from the dimensions of the data contained in the CSV. Modes starting with V have in the first column the values to which the color relates.
color_scale (number) – The value that represents white in the numbers describing the colors. Defaults to 255, could also be 1 or something else.
- classmethod from_np(path, *args, **kwargs)
Create Colormap from a numpy-file.
Create a colormap from a numpy data file
.npy
or.npz
.The data should contain at least three and at most five columns.
- Parameters
path (str or Pathlib.Path) – Path to file containing numpy data.
colormap_mode (str or None) – Optional. Can be None, “RGB”, “RGBA”, “VRGB”, or “VRGBA”. If None (default), this is inferred from the dimensions of the data contained in the CSV. Modes starting with V have in the first column the values to which the color relates.
color_scale (number) – The value that represents white in the numbers describing the colors. Defaults to 255, could also be 1 or something else.
- classmethod from_sequence_of_colors(colors, values=None, color_scale=255)
Create Colormap from sequence of colors.
Create a colormap from a sequence of colors, such as a list of colors. If values is not given, assume values between 0 and 1, linearly spaced according to the total number of colors.
For historical reasons, this method exists alongside
from_ndarray()
andfrom_array_with_metadata()
despite similar functionality.- Parameters
colors (Sequence) – List of colors, where each element must itself be a sequence of 3 or 4 numbers (RGB or RGBA).
values (array, optional) – Values associated with the colors. If not given, assume linear between 0 and 1.
color_scale (number) – The value that represents white in the numbers describing the colors. Defaults to 255, could also be 1 or something else.
- classmethod from_string(string, *args, **kwargs)
Create colormap from string.
Create a colormap from a string that contains comma seperated values (CSV).
To read from an external file that contains CSV, use
from_csv()
.- Parameters
string (str) – String containing CSV. Must have no less than three and no more than five columns and describe entirely numeric data.
colormap_mode (str or None) – Optional. Can be None, “RGB”, “RGBA”, “VRGB”, or “VRGBA”. If None (default), this is inferred from the dimensions of the data contained in the CSV. Modes starting with V have in the first column the values to which the color relates.
color_scale (number) – The value that represents white in the numbers describing the colors. Defaults to 255, could also be 1 or something else.
- palettize(data)
Palettize a monochromatic array data based on the current colormap.
- reverse(inplace=True)
Reverse the current colormap in place.
- Parameters
inplace (bool) – If True (default), modify the colors of this Colormap inplace. If False, return a new instance.
- set_range(min_val, max_val, inplace=True)
Set the range of the colormap to [min_val, max_val].
The Colormap’s values will match the range specified even if “min_val” is greater than “max_val”. To flip the order of the colors, use
reversed()
.
- to_csv(filename: Optional[str] = None, color_scale: Number = 255) Optional[str]
Save Colormap to a comma-separated text file or string.
The CSV data will have 4 to 5 columns for each row where each each row will contain the value (V), red (R), green (B), blue (B), and if configured alpha (A).
The values will remain in whatever range is currently set on the colormap. The colors of the colormap (assumed to be between 0 and 1) will be multiplied by 255 to produce a traditional unsigned 8-bit integer value.
- Parameters
filename – The filename of the CSV file to save to. If not provided or None a string is returned with the contents.
color_scale – Scale colors by this factor before converting to a CSV. Colors are stored in the Colormap in a 0 to 1 range. Defaults to 255. If not equal to 1 values are converted to integers too.
- to_rgb()
Return colormap with RGB colors.
If already RGB then the same instance is returned. If an Alpha channel exists in the colormap, it is dropped.
- to_rgba()
Return colormap with RGBA colors.
If already RGBA then the same instance is returned. If not already RGBA, a completely opaque (1.0) color
- to_rio()
Convert the colormap to a rasterio colormap.
Note that rasterio requires color tables to have round integer value control points. This method assumes that the range of this Colormap is already in the desired output range and to avoid issues with rasterio will round the values and convert them to unsigned integers.
- trollimage.colormap.can_be_block_mapped(data)
Check if the array can be processed in chunks.
- trollimage.colormap.colorbar(height, length, colormap)
Return the channels of a colorbar.
- trollimage.colormap.colorize(arr, colors, values)
Colorize a monochromatic array arr, based colors given for values.
Interpolation is used. values must be in ascending order.
- Parameters
arr (numpy array, numpy masked array, dask array) – data to be colorized.
colors (numpy array) – the colors to use (R, G, B)
values (numpy array) – the values corresponding to the colors in the array
- trollimage.colormap.palettebar(height, length, colormap)
Return the channels of a palettebar.
- trollimage.colormap.palettize(arr, colors, values)
Apply colors to data from start values.
- Parameters
arr (numpy array, numpy masked array, dask array) – data to be palettized.
colors (numpy array) – the colors to use (R, G, B)
values (numpy array) – the values corresponding to the colors in the array
Default Colormaps
Colors from www.ColorBrewer.org by Cynthia A. Brewer, Geography, Pennsylvania State University.
Sequential Colormaps
blues
greens
greys
oranges
purples
reds
bugn
bupu
gnbu
orrd
pubu
pubugn
purd
rdpu
ylgn
ylgnbu
ylorbr
ylorrd
Diverging Colormaps
brbg
piyg
prgn
puor
rdbu
rdgy
rdylbu
rdylgn
spectral
Qualitative Colormaps
set1

set2

set3

paired

accent

dark2

pastel1

pastel2

Rainbow Colormap
Don’t use this one ! See here and there why
rainbow