Colormap
Example usage
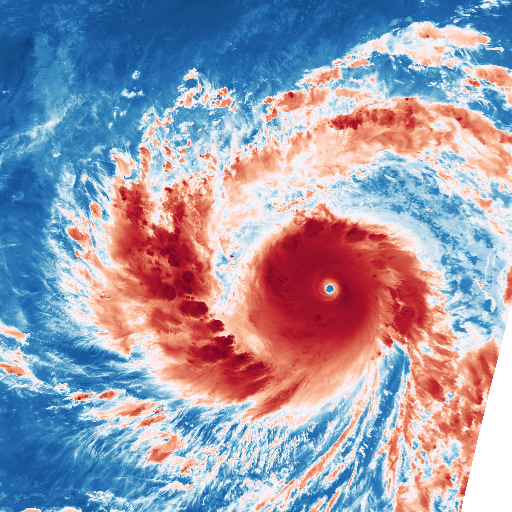
A simple example of applying a colormap on data:
from trollimage.colormap import rdbu
from trollimage.image import Image

img = Image(data, mode="L")

rdbu.set_range(-90 + 273.15, 30 + 273.15)
img.colorize(rdbu)

img.show()

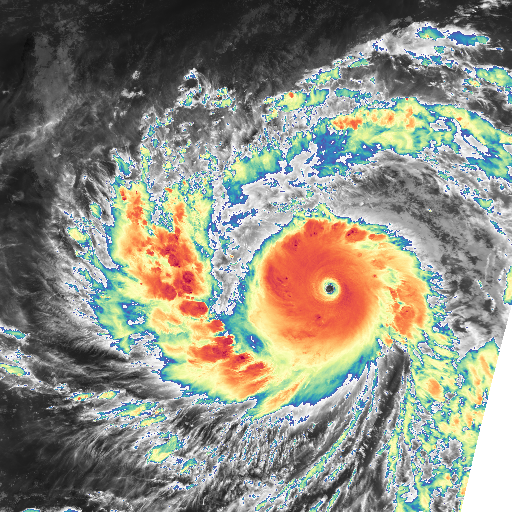
A more complex example, with a colormap build from greyscale on one end, and spectral on the other, like this:

from trollimage.colormap import spectral, greys
from trollimage.image import Image

img = Image(data, mode="L")

greys.set_range(-40 + 273.15, 30 + 273.15)
spectral.set_range(-90 + 273.15, -40.00001 + 273.15)
my_cm = spectral + greys
img.colorize(my_cm)

img.show()

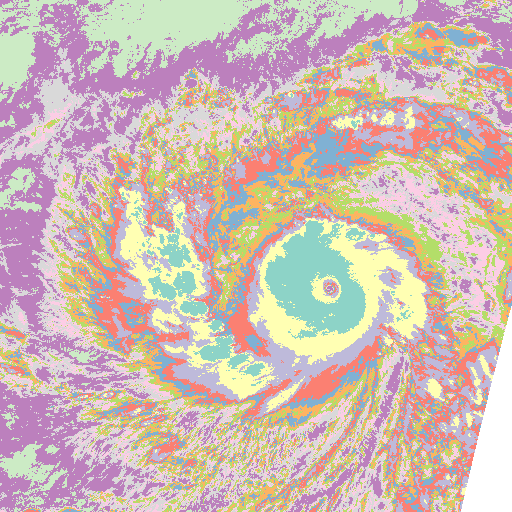
Now applying a palette to the data, with sharp edges:
from trollimage.colormap import set3
from trollimage.image import Image

img = Image(data, mode="L")

set3.set_range(-90 + 273.15, 30 + 273.15)
img.palettize(set3)

img.show()

API
See the Colormap API documentation.
Default Colormaps
Colors from www.ColorBrewer.org by Cynthia A. Brewer, Geography, Pennsylvania State University.
Sequential Colormaps
blues

bugn

bupu

gnbu

greens

greys

oranges

orrd

pubu

pubugn

purd

purples

rdpu

reds

ylgn

ylgnbu

ylorbr

ylorrd

Diverging Colormaps
brbg

piyg

prgn

puor

rdbu

rdgy

rdylbu

rdylgn

spectral

Qualitative Colormaps
accent

dark2

paired

pastel1

pastel2

set1

set2

set3

Rainbow Colormap
Don’t use this one ! See here and there why
rainbow
